
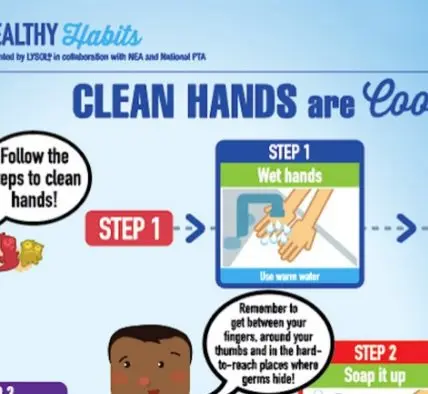
Healthy Habits
Teach Kids Time Management Lesson Plan
This project helps students see whether they’re investing enough time in tasks that promote healthy habits. By recording the amount of time they spend on various daily routines and comparing their habits with others in the class, students can use their graphs to discuss ways to improve overall health.

Download the Time Tally Lesson Plan
Goals and Skills
STUDENTS WILL:
- Practice telling and calculating time
- Organize and sort activities into categories
- Create and use circle graphs to organize information
- Learn about basic personal habits required to maintain health
- Collect, organize, interpret, analyze, and display data
SUPPLIES AND PREPARATION:
- Make copies of the student handouts Healthy Habits Time Tally and My Daily Activity Circle (see Pages 4 and 5)
- Color markers, crayons, or pencils (red, orange, purple, yellow, green, blue, pink) OR
- Computer or iPad/tablet access
Instruction Steps
1. SHARE.
Distribute copies of the Healthy Habits Time Tally and My Daily Activity Circle Graph to each student.
2. BRAINSTORM.
Ask students to think about other tasks that may be added to the list of the Healthy Habits Time Tally chart. Is there anything they do on a daily basis that is not on the list? If so, have them write them in at the bottom of the chart. Encourage them to think about things they do in the morning, at school, after school, at home, and at night.
3. TRACKING TIME!
Go over the instructions on each handout to explain the project to students. Explain that they will first spend one day, or 24 hours, tracking how much time they spend on each activity. Review the basics of telling time. Cover how many hours are in a day, how many minutes are in an hour, and how many quarters are in an hour. They will be tracking their time in 15-minute increments.
Begin the project in class so that students have time to practice the activity. For example, as a class you may track the time spent “going to school,” “washing hands,” “eating,” and “reading.”
Modifications:
If tracking time in 15-minute increments is too challenging for some students, have them write down the time they begin an activity, and the time it finished. Then assist them with the final calculations.
4. ADD UP TIME.
After the tracking activity is complete, help students add up the time they spent doing different activities. Make sure their activities add up to 24 hours (give or take 15 minutes).
5. SORT ACTIVITIES.
Once the time has been tallied, activities will need to be sorted into different categories (see the color-coded key on My Daily Activity Circle Graph). For example, “watching TV” and “playing video games” would fall under “Entertainment.” Work with students to sort activities and add up their times.
6. MY DAILY ACTIVITY CIRCLE GRAPH.
Explain that students will now use a circle graph to color in and “map” the time they spend doing different things each day. Each section of the graph represents one hour of a day. Provide a few examples of time and activities to model how to fill in the graph.
For example, if a student spent only 15 minutes on an activity, that is ¼ of an hour. Therefore, on the circle graph, they will only color in ¼ of a circle section. If they spent 2 hours on an activity, they would color in 2 circle sections.
Remember to use different colors for different tasks, as explained in the key of the circle graph.
Modifications:
Alternately, you can use this as an opportunity for students to practice graphing on computers or iPads/tablets.
7. INTERPRET AND EVALUATE RESULTS.
Display completed graphs on a bulletin board. Invite students to share their observations about different graphs with the rest of the class. Are there any patterns children see? Ask students to interpret what they mean. For example, if the color purple is bigger than the color green, it means that more time is spent on entertainment than physical activity.
Ask students to evaluate if their class spends enough time on physical activity. How can their everyday habits be affecting their overall health? What can they do differently? What can you as a class do differently together?
8. EXTEND THE LESSON.
Ask the class to continue to record and tally their habits for several days or weeks. Then have them identify trends and changes in their behaviors using bar charts—for instance, tracking whether they spend enough time outdoors. Invite parents to take part by helping students track their habits at home using a mobile application such as iRewardChart.
9. HOME CONNECTION.
Let parents know about the Healthy Habits Time Tally activity in advance of the lesson. That way, parents can help students track their time at home during various activities. At the end of the lesson, share results with parents. What healthy habits can they support at home? Exercising more?


DISCLAIMER:
Healthy Habits® is Presented by Lysol® in collaboration with NEA and National PTA
SOURCES:
Education Standards: (NHES) Health: 1.5.1, 5.5.4, 6.5.1, 7.5.1; (CCSS) English Language Arts: SL.K-1.1, L.K.5; (CCSS) Math: K.CC.A.3, K.CC.C.6, K.MD.B.3,1.MD.C.4
For more resources, visit CDC – Be A Germ Stopper Poster https://www.cdc.gov/handwashing/pdf/294906-handwashing-superhero-boy-p.pdf
https://www.cdc.gov/handwashing/pdf/294906-handwashing-superhero-girl-p.pdf
CDC – Healthy Schools Parent Engagement Materials https://www.cdc.gov/healthyschools/parentsforhealthyschools/p4hs.htm